Over the last two weeks, we’ve received concerned calls from folks wanting to discuss the state of today’s economy. There seems to be no escaping the inverted yield curve hysteria. Below you’ll find an indepth look at inverted yield curves, their history and today’s market written by my associate, Ed Charvaletti and edited by me. For those of you who want to fast forward to the bottom line, there is an executive summary at the end.
Enjoy your day!
The yield curve. Touted by industry professionals as a proverbial crystal ball, the inversion of the yield curve is believed to spell the end of bull markets. And with the 10-year treasury yield falling below the 2- year treasury yield, the talking heads have all begun to sound the alarms for impending recession.
However, we would like to ignore the noise and analyze the 2-year/10-year yield curve inversion for ourselves. Is the yield curve inversion a reliable indicator of recession? How soon after does a recession occur? And most important, how does the yield curve’s inversion affect your investments? Let’s find out!
Yield Curve Crash Course: Why Its Inversion Is Interpreted Negatively?
The yield curve is simply a measure of how much it costs to borrow money for different time frames. In general, investors need an incentive to tie up their money for a longer period of time. With potential economic risks like inflation, interest rate cuts, and the global economy on the horizon, investors typically require a higher yield to make up for the risk that they take on with these longer-term securities. As such, a healthy yield curve curves upward; the longer an investor’s money is tied up, the higher their yield will be.
Now that we have a basic understanding of the yield curve, it begs the question: why does the yield curve invert? As its name suggests, an inverted yield curve results when the yields of long-term securities are lower than the yields of short-term securities. When investors fear a recession is imminent, they know that the Federal Reserve cuts interest rates to fend off deteriorating economic growth. If investors were to buy short-term bonds, they would have to reinvest their money in a few months at the new, lower rate set by the Fed. To avoid this reinvestment risk, investors instead flee to long-term bonds to lock in these higher interest rates before any rate cuts. However, this demand for long-term securities has a negative impact on the yields of these bonds. Since these long-term bonds are in demand, they don’t need as high of a yield to attract investors to tie up their money in them. As such, this demand for long-term bonds causes their yields to decline, sometimes to the point of falling lower than the short-term yields. When this occurs, we call it an inverted yield curve.
What Does History Tell Us About Inverted Curves?
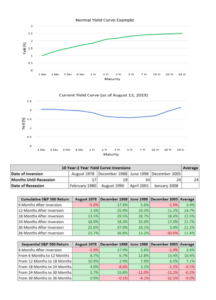
If an inverted yield curve is a predictor of economic recession, it only makes sense that we test that theory by comparing the onset of recessions to the inversions of the yield curve. To analyze this correlation between recessions and the yield curve, we will look at four distinct periods: the “Double- Dip” recessions of 1980 and 1981-82, the relatively mild recession of the early 1990s, the “Dot-Com Bubble” of the early 2000s, and the “Great Recession” of the late 2000s. In the table at the end of this article, we observed the date of the initial yield curve inversion before each recession versus the starting date of each respective recession. In August 1978, the yield curve inverted. However, the first half of the “Double-Dip” recession did not begin until February of 1980, 17 months later. When the recession began in August of 1990, the yield curve had inverted 19 months earlier in December 1988. In addition, the yield curve inverted in June of 1998, 34 months before the beginning of the “Dot-Com Bubble,” and the yield curve inverted in December of 2005, 24 months before the beginning of the “Great Recession.” If you were to average these four timeframes, the inverted yield curve occurred roughly 24 months before the onset of each economic recession, making it a reliable, leading indicator for recession.
How Does This Affect Me and My Investments?
Now that we have verified the reliability of the inverted yield curve acting as a leading indicator of economic recession, let’s get to the burning question on your mind: how does this affect me? The S&P 500 is a market index that includes 500 of the largest U.S. companies; when you hear people refer to “the market,” the S&P 500 is typically the index they are referencing. In the table at the end of this article, we have calculated the S&P 500’s returns over multiple time frames for each yield curve inversion preceding their respective recessions.
The top table tracks the cumulative S&P 500 return after each date of inversion, breaking up the cumulative return into 6-month intervals. As you can see from this table, the average market return after the yield curve inversion continues to increase until 18 months after the initial inversion. After 18 months, however, you can see that the average return begins to decline, suggesting that the market tends to begin losing value after the 18 months.
The bottom table tracks the S&P 500’s returns for each sequential 6-month interval during these four timeframes. For example, “From 6 Months to 12 Months” displays what the market returned from its value 6 months after the inversion to 12 months after the inversion, and so on. Like the previous table, the average market return remains positive all the way until 18 months after the yield curve’s inversion. However, after 24 months, the market return begins to deteriorate.
What does this mean for your investments? Well, two things. One, the market continues to average positive returns up until 18 months after the yield curve’s inversion, so pulling out of the market today may be premature. Two, the past four recessions have occurred 24 months, or two years, after the inversion, so history tells us that we should tread carefully but confidently for the foreseeable future. In addition, all three long-term indicators that we follow remain positive.
Summary
In short, the inversion of the yield curve does precede recessions, but it tends to be a very early indicator. As such, we will remain in the market in pursuit of the anticipated 18 months of positive returns to follow this inversion. We will continue to monitor current market and economic conditions, and we will let you know if we see any material changes in the investing landscape. If you have any additional comments or concerns, contact us at 561-288-1160. Thank you.